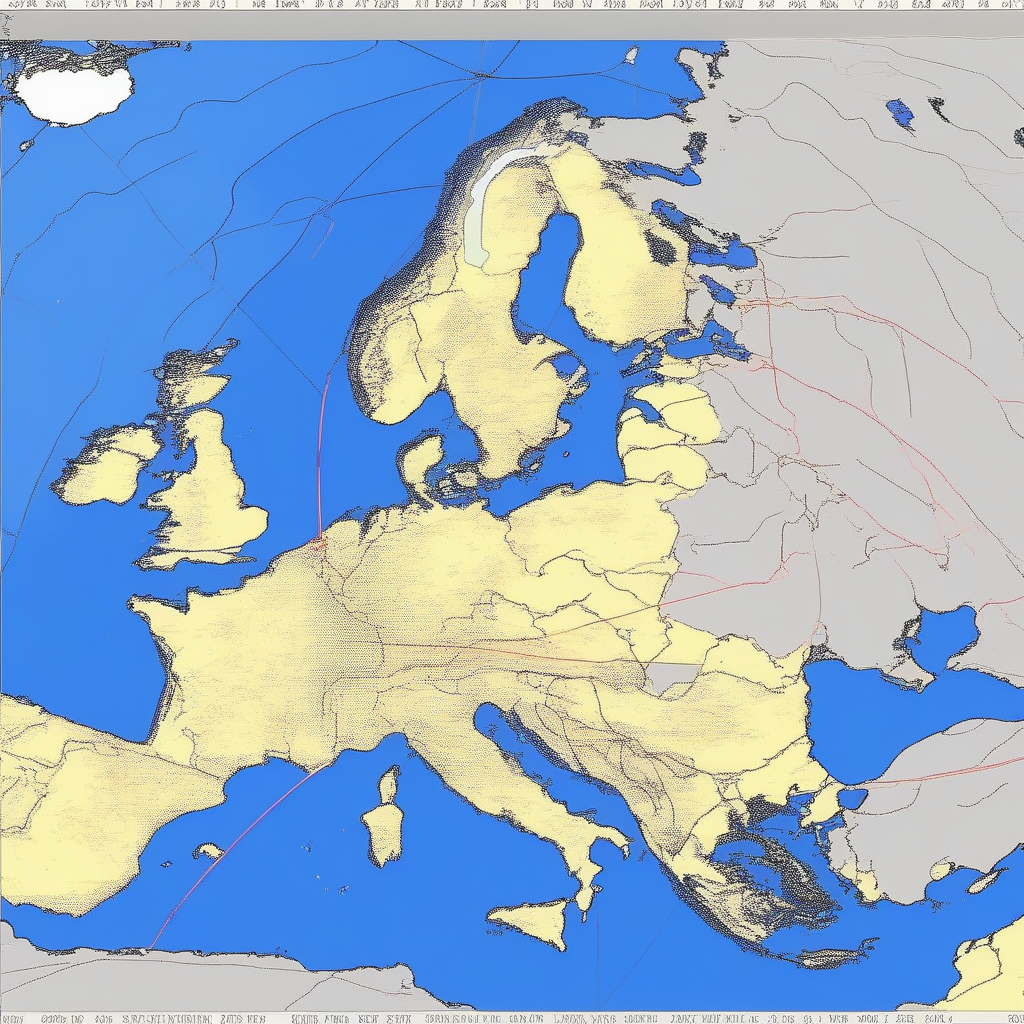
An isotherm is a term used in meteorology and climatology to describe a line on a weather map that connects points of equal temperature. These lines are typically drawn in intervals of 5 or 10 degrees Fahrenheit or Celsius, depending on the scale of the map. Isotherms are an important tool for visualizing temperature patterns and understanding how temperature changes across a region.
Isotherms are often used in weather forecasting to identify areas of warmer or cooler temperatures and to help predict the movement of weather systems. By analyzing isotherms, meteorologists can determine the boundaries between different air masses and predict how they will interact and influence weather conditions. Isotherms can also be used to track the movement of cold fronts, warm fronts, and other weather phenomena.
In addition to their use in weather forecasting, isotherms are also important in climate studies. By analyzing long-term temperature data and mapping isotherms, scientists can identify trends in temperature patterns and study how they have changed over time. This information is essential for understanding the impacts of climate change and for predicting future climate trends. Overall, isotherms are a valuable tool for studying and interpreting temperature variations in the atmosphere.
